
AMD Patents a Real-Time Debugger That Freezes GPU Partition Switching
Debugging a GPU that's simultaneously serving multiple virtual machines is a bit like trying to read a spinning roulette wheel — AMD's new patent wants to pause the spin just long enough to take a clean snapshot.
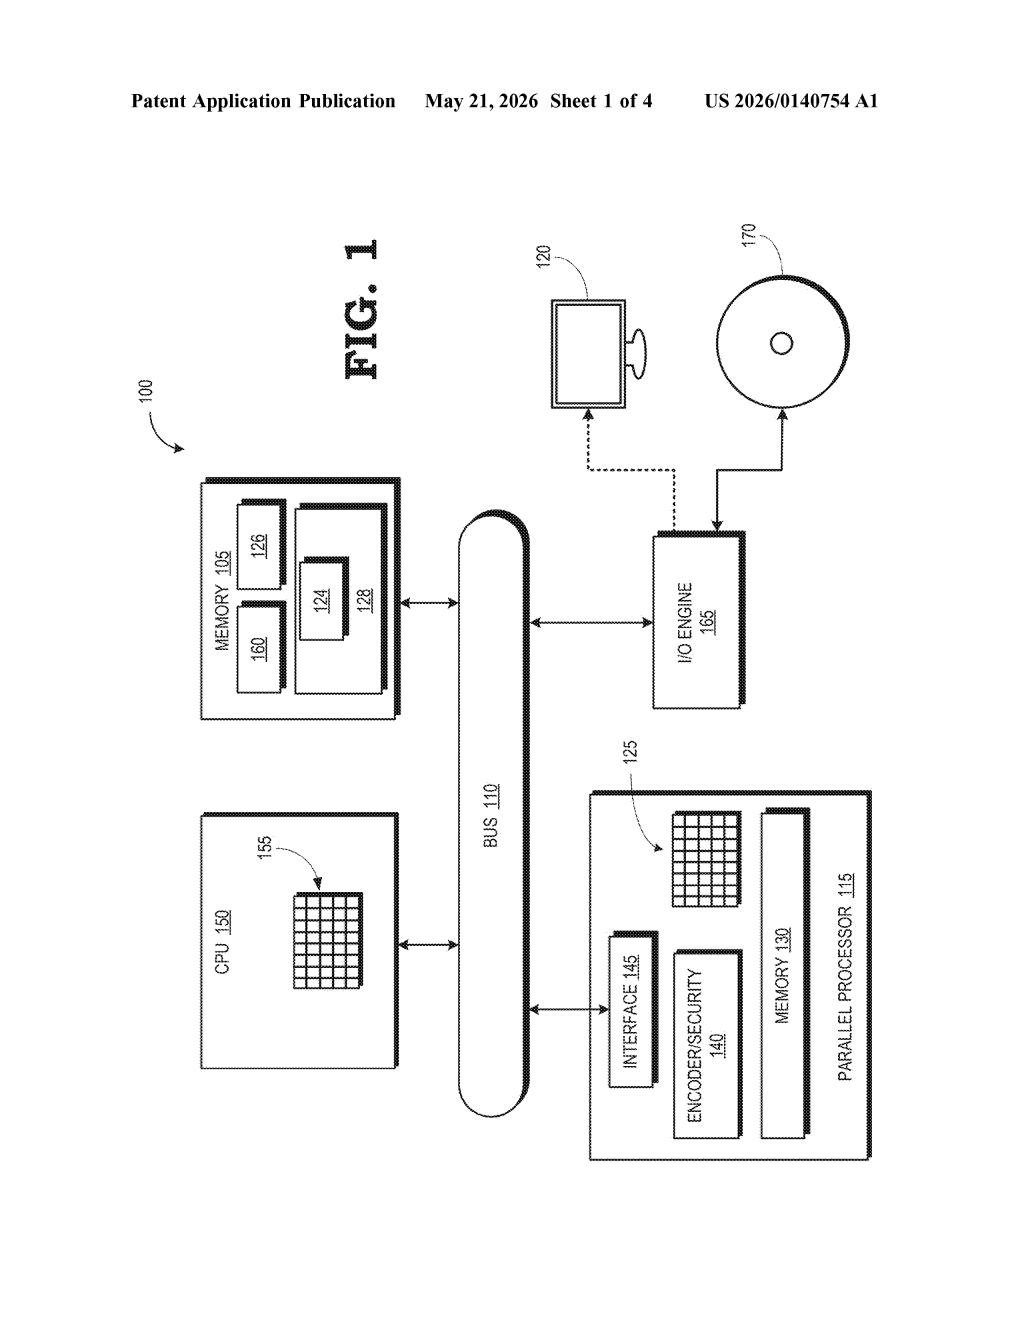
What AMD's virtualized GPU debugger actually does
Imagine a single GPU being shared among several virtual machines in a cloud server, each taking turns using the hardware for a few milliseconds at a time. If something goes wrong inside one of those virtual slices, a developer needs to pause and inspect the GPU's internal state — but the hardware keeps rotating between tenants, making that nearly impossible.
AMD's patent describes a background software service (a daemon) that watches for a developer's debugging tool to connect via a virtual COM port. The moment it detects that a kernel debugger has started a session, it tells the host to freeze that rotation — holding the GPU in the specific virtual slice the developer cares about.
Once the debugger has finished reading the hardware registers it needs, the daemon signals the host to resume normal time-sharing. The whole process is designed to be transparent: the other virtual machines just wait a beat, and then everything picks back up as if nothing happened.
How the daemon halts world switching on demand
Modern GPU virtualization uses a technique called world switching (also called time-sliced partitioning): the GPU rapidly cycles through multiple virtual functions (VFs) — each one a slice of GPU resources assigned to a separate virtual machine — so each VM gets a fair share of compute time.
The patent introduces a daemon running in the host OS that monitors virtual COM ports — serial communication endpoints exposed to each VM. When a kernel debugger (a low-level developer tool that can inspect OS and driver internals) initiates a session on one of those ports, the daemon detects it and sends a halt signal to the host driver.
The host driver then stops the round-robin world switch, leaving the target virtual function as the active partition. With the GPU frozen on that slice, the kernel debugger can safely read hardware registers — internal state variables like queue pointers, error flags, or memory addresses — without the values changing mid-read because the GPU switched contexts.
- Daemon monitors all virtual COM ports continuously
- Detects kernel debugger session initiation on any VF
- Signals host to halt world switching, promoting target VF to active
- Resumes world switching once the debugger signals completion
What this means for cloud GPU debugging workflows
For anyone running multi-tenant GPU workloads — cloud inference, virtual desktop infrastructure, or HPC clusters — debugging a misbehaving VM today usually means either taking the whole GPU offline or flying blind. AMD's approach offers a surgical pause that lets engineers inspect a single virtual function without disrupting the others any more than necessary.
This is particularly relevant as GPU partitioning (via SR-IOV and similar standards) becomes more common in data centers. Better debugging tooling lowers the operational cost of running shared GPU infrastructure and should make root-cause analysis of driver or firmware bugs significantly faster.
This is unglamorous but genuinely useful infrastructure work. Debugging virtualized GPU slices is a real pain point for anyone operating shared GPU pools, and a daemon-mediated pause mechanism is an elegant solution. It won't ship in a consumer product, but it's the kind of tooling that makes enterprise GPU deployments actually maintainable.
Get our take in your Top Stories
Liked this breakdown? Add Patentlyze as a preferred source on Google, and our plain-English take shows up more often in your Top Stories the next time AMD patent news breaks.
There are more where this came from
We read every patent application Big Tech publishes and send you the ones worth knowing. Plain English, free, every week.
Want this weekly breakdown for a company we don't cover? Patentlyze Pro →