
Apple Patents a Floor-Plan View That Shows How Air Quality Moves Through Your Home
Apple has filed a patent for a system that takes readings from a physical device in your home and then draws a live, location-accurate map showing how that characteristic spreads across your entire space. Think of it as a weather map for the inside of your house.
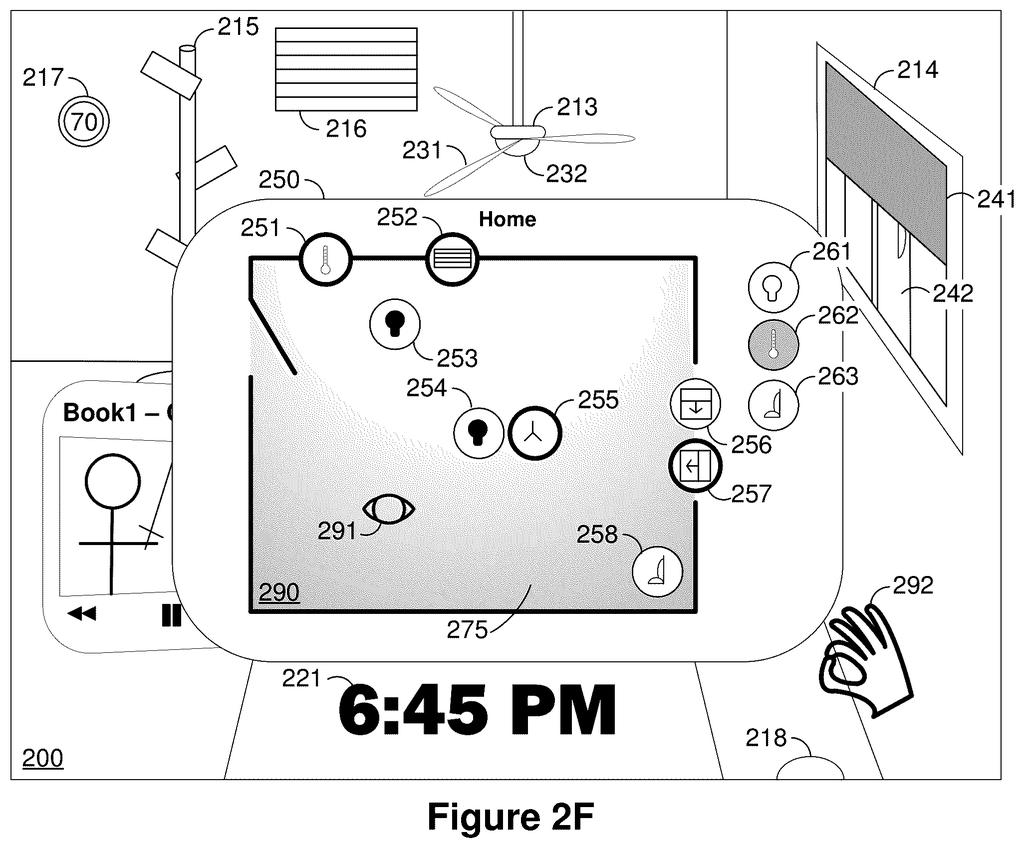
What Apple's environmental map actually shows you
Ever tried to figure out whether the air in your bedroom is as stuffy as the living room feels? Right now, most smart-home apps just show you a number from whatever sensor you own. Apple's patent describes something different: a virtual map of your home that shows an environmental characteristic, like temperature, air quality, or humidity, spread across every corner of the floor plan at once.
The app would pull status information from a physical device (a thermostat, an air purifier, a sensor) sitting at a known spot in your home. It would then calculate what that reading likely means for other locations in the space and display color-coded or labeled indicators at each of those spots inside a visual layout of your rooms.
You would not need a sensor in every room. The system infers values for places where no device is sitting, using the readings it does have. The result is a single screen that tells you at a glance what is happening in your whole home, not just at one point.
displaying a virtual representation of a physical environment; obtaining, from a physical device at a device physical location in the physical environment, status information indicating a status of the physical device; …
Translation: The system shows a digital layout of a home and gathers data from smart devices inside it.
How the system maps sensor data across virtual locations
The patent describes a three-step display pipeline running on a device with a screen (most likely a phone, tablet, or dedicated home display).
Step 1 - Virtual environment: The system renders a virtual representation of a physical environment, essentially a floor plan or 3D map of a room or home. Each spot in that virtual map corresponds to a real physical location.
Step 2 - Device status ingestion: The system pulls status information from a physical device sitting at a known location. That device might be an air-quality monitor, a smart thermostat, or a similar sensor. The status data tells the system what that device is currently reading or doing.
Step 3 - Multi-location value estimation: Using that status information as input, the system determines values of an environmental characteristic at multiple locations across the physical space, not just at the sensor's own spot. Those estimated values are then displayed at their corresponding virtual locations inside the floor-plan view.
The claim is written around a general "environmental characteristic" rather than naming a specific one like CO2 or temperature. That broad framing means the same system architecture could apply to noise levels, Wi-Fi signal strength, humidity, or anything else a connected device might report.
… determining a plurality of values of an environmental characteristic of the physical environment at a plurality of environment physical locations in the physical environment, …
Translation: It calculates air conditions across multiple spots in the home using that device data.
What this means for smart-home displays and HomeKit
For anyone managing a smart home, the gap between "I have a reading" and "I understand my whole space" is real. A single number from a sensor does not tell you whether the problem is localized or building everywhere. Apple's approach of extrapolating values across a floor plan from one or more anchor devices could make that spatial picture instantly readable, the way a weather radar makes regional conditions obvious at a glance.
Apple's run of HomeKit and smart-home filings suggests this is part of a longer effort to make home data feel cohesive rather than fragmented across individual device apps. If this system shows up in the Home app or on an Apple home hub display, it could meaningfully change how people interact with their indoor environment data every day.
That makes this Apple's 368th filing in our Apple coverage since May, adding to work like voice commands tied to the screen and blocking Bluetooth hijacks.
Claim 1 covers any system that displays a map of a real space, pulls status data from a connected device at a known location in that space, and then calculates and shows environmental readings across multiple points on that map. The claim sets no boundaries on sensor type, calculation method, or how the results are displayed, which makes it unusually wide.
In practice, that breadth could reach almost any smart-home app that takes a reading from a thermostat or air quality monitor and uses it to estimate conditions in nearby rooms, shown on a floor plan. That describes a large and growing category of everyday home-management software.
Whether Apple can hold that ground depends on how much the claim shrinks during review, since examiners tend to push back hard on coverage this sweeping. A narrowed version could still matter significantly, but right now the claim as written is doing a lot of heavy lifting.
Get our take in your Top Stories
Liked this breakdown? Add Patentlyze as a preferred source on Google, and our plain-English take shows up more often in your Top Stories the next time Apple patent news breaks.
There are more where this came from
We read every patent application Big Tech publishes and send you the ones worth knowing. Plain English, free, every week.
The drawings
16 drawing sheets from US 2026/0260440 A1 · click any drawing to enlarge


Show the other 8 sheets


Want this weekly breakdown for a company we don't cover? Patentlyze Pro →
Be the first to weigh in