
Salesforce Patents a System That Finds Which Searches Are Slowing Down Its Servers
When thousands of companies share the same database infrastructure, one badly written query can drag performance down for everyone. Salesforce's new patent is about catching that query before it becomes a bigger problem.
What Salesforce's query-monitoring system actually does
Imagine a busy apartment building where all the tenants share the same water pressure. If one unit runs every appliance at once, the showers on other floors suffer. Salesforce's cloud databases work similarly: thousands of businesses run queries on shared servers, and a single inefficient query can eat up processor time that everyone else needs.
This patent describes a system that watches those queries in real time, strips out noise, and identifies which ones are burning through the most CPU time or taking too long to complete. It can spot problems at multiple levels: across the entire server fleet, on a single machine, or tied to a specific user.
When it finds a troublemaker, it digs deeper to understand trends over time and then sends an alert so engineers can fix it before other customers notice a slowdown.
… applying tokenization in the ingestion pipeline to remove uninformative terms when attempting to extract keywords from the queries …
Translation: It filters out junk words to focus on the search terms that actually matter.
How the pipeline flags and ranks resource-hungry queries
The patent describes a pipeline that ingests queries as they flow through Salesforce's database servers. At regular intervals, it pulls out keywords from those queries and applies tokenization (a text-processing step that strips out filler words and irrelevant terms so the system focuses only on the meaningful parts of each query).
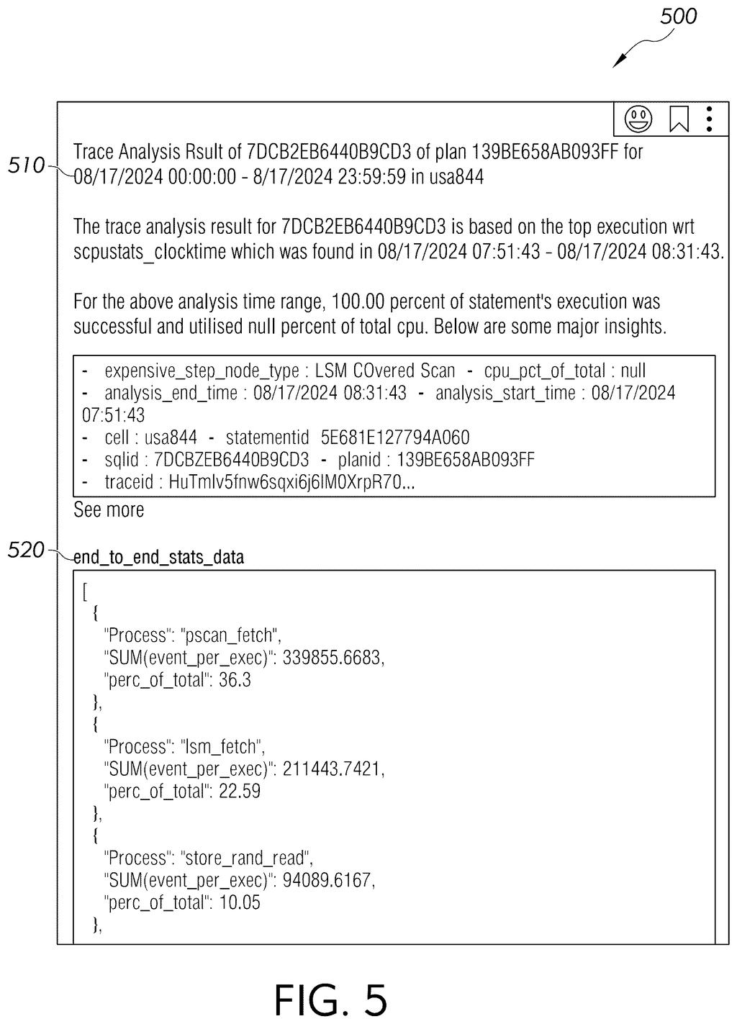
From there, an enrichment analysis module compares query behavior against historical baselines using statistical analysis. It flags any query whose CPU footprint (how much processor effort it demands) or execution time (how long it takes to finish) crosses a configurable threshold set by administrators.
For queries that trip those thresholds, the system runs a deeper drill-down analysis that includes:
- A CPU projection trend (is this query getting worse over time?)
- Average CPU time per execution (is it consistently slow, or just occasionally?)
- Categorization by whether the problem sits at the fleet level, one specific server, or one specific user
Finally, the system fires off alerts to the appropriate teams so the issue can be investigated and corrected.
… detecting at least one query from the received set of queries that are resource intensive at a fleet level, individual server level, or user level based on the keywords …
Translation: It spots sluggish searches across entire server fleets, single machines, or specific user accounts.
What this means for Salesforce's multi-tenant cloud customers
Salesforce runs one of the largest multi-tenant SaaS platforms in the world, meaning millions of users across different companies share the same underlying infrastructure. A single customer's poorly optimized query could, in theory, degrade performance for unrelated businesses on the same server cluster. Automated detection at this level of granularity is genuinely useful for an operation that scale.
For Salesforce customers, this kind of internal tooling is invisible but directly affects the responsiveness of CRM dashboards, reports, and automations they rely on every day. If this system works as described, it would let Salesforce's engineering teams act on emerging performance problems faster, before users notice anything.
This is internal plumbing, not a flashy consumer feature, but it addresses a real and expensive problem in large-scale SaaS operations. The multi-level detection approach (fleet, server, user) is a sensible design that makes the resulting alerts actionable rather than vague. It's a solid infrastructure patent, not an exciting one.
There are more where this came from
We read every patent application Big Tech publishes and send you the ones worth knowing. Plain English, free, every week.
The drawings
11 drawing sheets from US 2026/0228216 A1 · click any drawing to enlarge


Want this weekly breakdown for a company we don't cover? Patentlyze Pro →
Be the first to weigh in