Nvidia Patents a 3D Visualization System for Datacenter Infrastructure
Managing a modern AI datacenter means keeping track of thousands of servers, network links, and live performance metrics — all at once. Nvidia's new patent proposes turning that chaos into a navigable 3D map.
What Nvidia's 3D datacenter map actually shows you
Imagine trying to understand a city's entire road network, every building, and real-time traffic — all from a flat spreadsheet. That's roughly what datacenter operators face today when diagnosing problems across thousands of machines and connections.
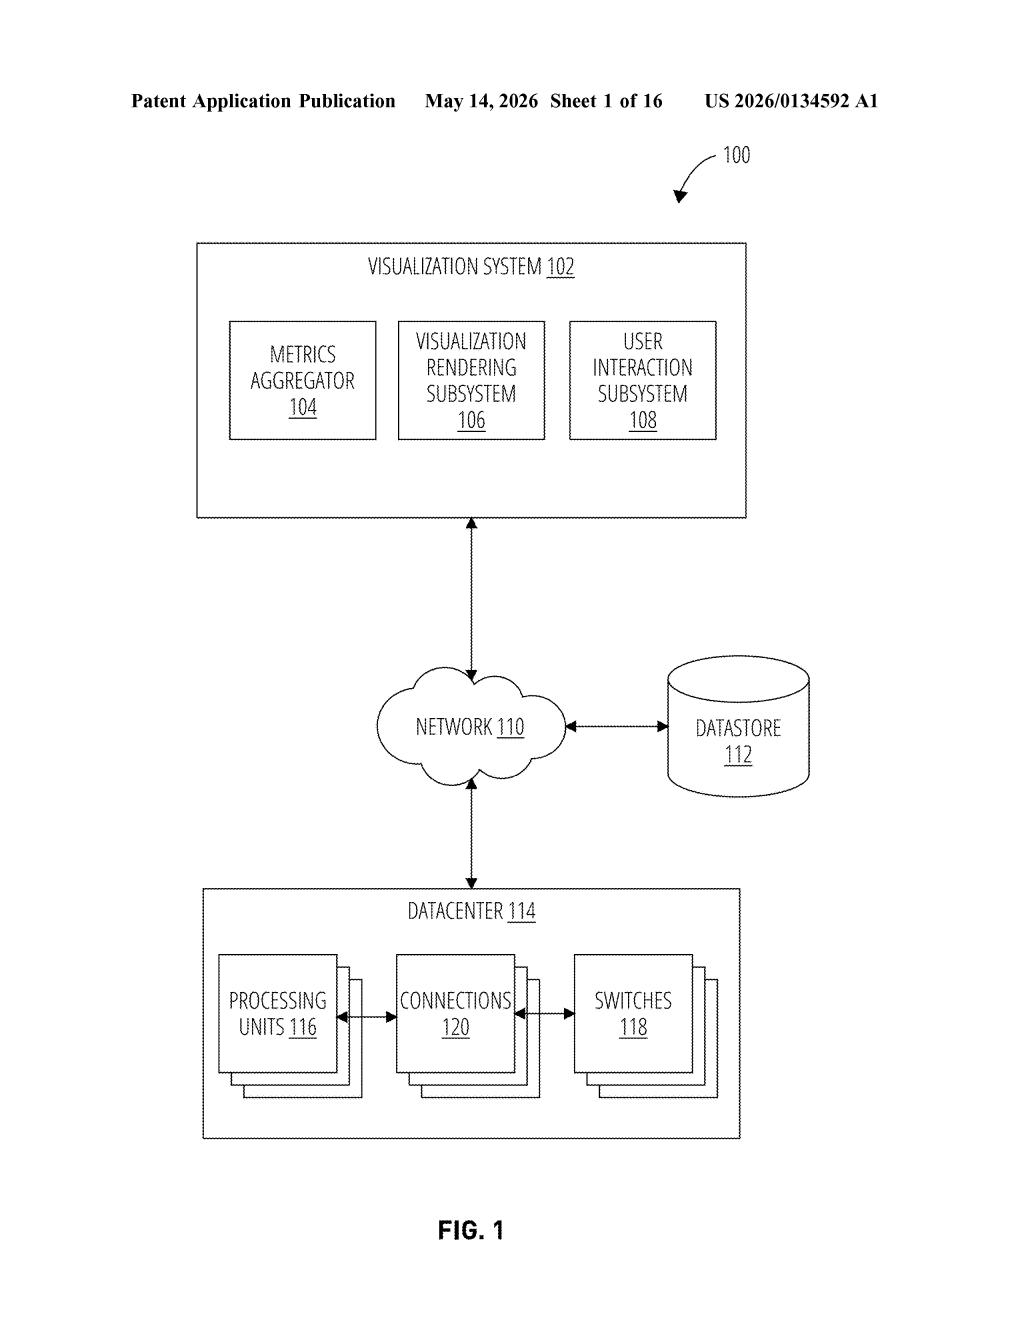
Nvidia's patent describes a system that takes a live snapshot of a datacenter — all its servers, switches, and network links — and renders it as an interactive 3D visualization. Instead of rows in a table, you'd see objects floating in space, where where something sits in the 3D scene actually tells you something meaningful about it, like its load, status, or role.
So a heavily loaded GPU node might appear in a different position along one axis than an idle one. Connections between machines appear as visual links between those objects. The goal is to let operators see relationships and anomalies at a glance, rather than hunting through dashboards.
How entity properties drive spatial position in the 3D view
The patent describes a method for ingesting datacenter state information — a structured snapshot covering entities (think: individual servers, GPUs, switches, storage nodes), the connections between them (network links, fabric paths), and per-entity properties (metrics like utilization, health status, or role).
From that data, the system generates a 3D visualization with distinct visual element types:
- First visual elements — one class of datacenter entity (e.g., compute nodes)
- Second visual elements — a second class (e.g., networking switches)
- Third visual elements — the connections between entities, rendered as lines or edges in 3D space
The key technical detail is that spatial position is data-driven: the X, Y, or Z coordinate of a visual element is determined by one or more entity properties, not just by arbitrary layout. In practice, this means an axis in the 3D scene might encode something like GPU memory usage or rack location — so proximity in the visualization reflects real operational relationships.
The claim also covers generating a specific first view, implying the system supports multiple viewpoints or camera angles into the same underlying 3D model.
What this means for managing AI-scale datacenter complexity
As Nvidia's customers build ever-larger GPU clusters for AI training, datacenter observability becomes a serious operational problem. When you have tens of thousands of interconnected nodes, a flat list of metrics is nearly useless for spotting a bad link or a thermal hotspot. A spatial 3D view where position encodes meaning could let an operator spot cluster-wide patterns — like a band of overloaded nodes — in seconds instead of minutes.
This also fits neatly with Nvidia's push into datacenter management software alongside its hardware. Tools like this could ship as part of its networking or cluster management stack, making Nvidia stickier as a platform — not just a chip vendor — for hyperscalers and AI cloud operators.
This is a real but fairly incremental idea — 3D network visualization has existed in enterprise IT tools for years. What makes it worth watching is the explicit data-driven positioning: tying spatial coordinates to live metrics, rather than just drawing a pretty topology map, is the move that separates a useful tool from a marketing demo. Whether Nvidia ships this as a standalone product or folds it into something like DOCA or Base Command is the interesting question.
Get one Big Tech patent every Sunday
Plain English, intelligent commentary, no hype. Free.
Editorial commentary on a publicly published patent application. Not legal advice.