
Sony Patents a Tool That Checks Cause-and-Effect Diagrams Before Crunching the Numbers
When researchers try to figure out whether one thing actually causes another, the diagram they draw to represent those relationships has to be set up correctly, or the math that follows is meaningless. Sony's new patent is for software that catches those setup errors before they happen.
What Sony's causal graph checker actually does
Analysts who study cause and effect, like whether a drug dosage actually changes patient outcomes, use a kind of flowchart called a causal graph. Every arrow in that chart has to point in the right direction, or any calculation built on it will be wrong. Sony's patent describes software designed to catch those directional errors before the analysis runs.
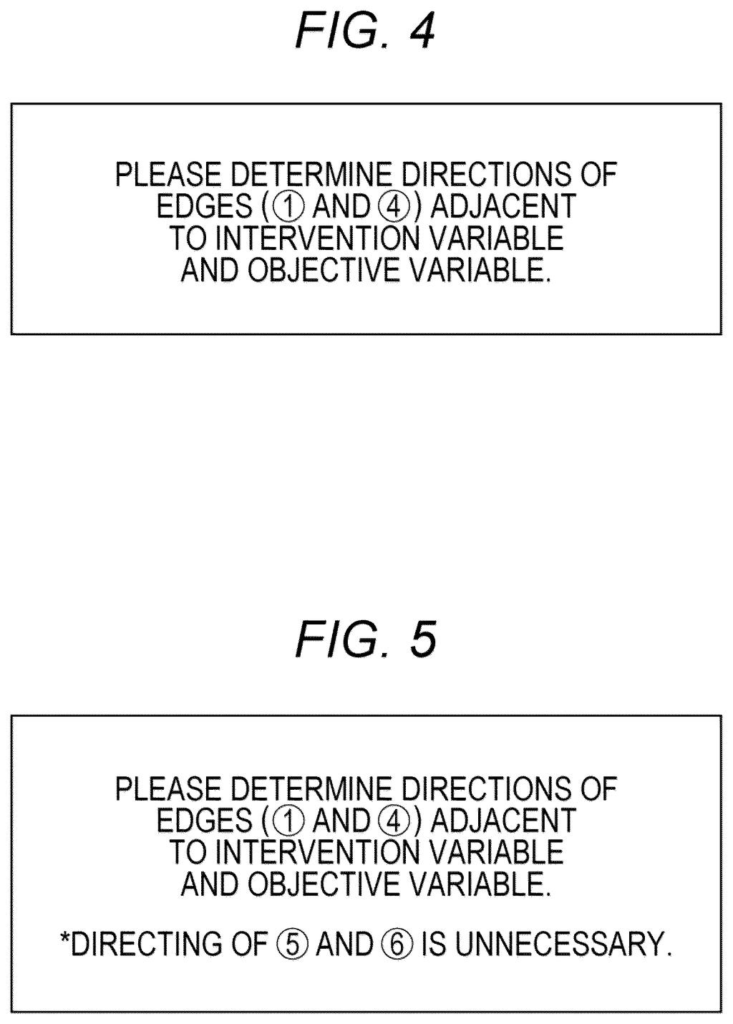
The tool inspects specific arrows in the chart, particularly the ones connected to whatever you're testing (the thing you're changing) and whatever you're measuring (the outcome). If any of those arrows are ambiguous or missing a direction, the software flags them and tells you which ones need to be fixed and why.
The practical effect is that you get a warning before you waste time on a flawed calculation, rather than discovering the problem after the fact, when the results are already on the table.
… a graph inspection unit that performs an inspection of edge direction in a causal graph when performing an intervention effect calculation from an intervention variable to a reaction variable in the causal graph, and a presentation unit that presents information regarding necessity of directing of a part of edges …
Translation: It reviews the cause and effect chart and tells you which connection arrows still need to be properly pointed.
How the inspection and presentation units work together
A causal graph is a diagram where boxes represent variables (like dosage, blood pressure, or sales spend) and arrows show which ones influence others. The direction of each arrow matters enormously: an arrow from A to B means A causes B, not the other way around. When a graph has undirected or ambiguous edges (connections without a clear direction), any calculation about the effect of intervening on one variable will be unreliable.
Sony's patent describes a two-part system built to solve this:
- Graph inspection unit: Before any calculation runs, this component checks whether the edges adjacent to the intervention variable (the thing being changed) and the reaction variable (the thing being measured) have clear directions assigned.
- Presentation unit: Based on what the inspection finds, this component surfaces the specific edges that need to be directed and communicates why they matter for the calculation at hand.
The key insight is that not every edge in a large causal graph needs to be perfectly defined for a specific calculation. The system focuses its checks narrowly on the edges that actually affect the result you are trying to compute, which makes the tool practical even for complex, partially-specified graphs.
What this means for data analysts using causal models
For data scientists and researchers working with causal inference, a misconfigured graph is a silent error. The software runs, produces numbers, and no alarm goes off. The problem only surfaces when someone scrutinizes the methodology, sometimes after decisions have already been made. Sony's steady investment in data analysis tooling suggests the company sees enterprise analytics software as a real growth area.
This patent targets that failure mode directly. By automating the check and pointing to specific problem edges rather than just rejecting the entire graph, it makes causal analysis more accessible to analysts who are not causal-inference specialists, and it reduces the chance that a subtle diagram error undermines an otherwise careful study.
This is the fifth Sony filing in our Language AI coverage we have tracked since May, joining letting players design characters by text and typing text in your own handwriting.
Misdirected arrows in causal diagrams are a quiet but costly failure mode. When analysts map out cause-and-effect relationships to answer questions like "what happens to sales if we change this price," a single wrongly drawn connection can reverse the answer entirely, leading to decisions that hurt rather than help.
Sony's patent targets that specific failure point with a narrow, pre-calculation check that flags only the connections most likely to corrupt a result. That focused scope is appropriate to the problem, a surgeon's instrument rather than a renovation.
Whether the tool reaches people beyond specialized research teams depends on whether Sony builds it into an environment analysts already inhabit. The check itself solves a real cost, but only if it travels to where the decisions are being made.
There are more where this came from
We read every patent application Big Tech publishes and send you the ones worth knowing. Plain English, free, every week.
The drawings
22 drawing sheets from US 2026/0268170 A1 · click any drawing to enlarge


Want this weekly breakdown for a company we don't cover? Patentlyze Pro →