
Google Files Patent for a Tool That Tells Creators Where Viewers Will Quit
Google has filed a patent for a system that predicts the stretches of your video where viewers are likely to give up, before a single person has watched it. Creators could then fix those spots and check again.
What Google's drop-off forecast does for creators
Imagine you spend a weekend editing a 12-minute video and upload it. Weeks later, the numbers show that lots of people left around the four-minute mark, right when you launched into a long explanation. By then, the damage is done.
Google's patent describes a way to get that warning on day one. A computer model studies the pictures and sounds in your video and flags the time windows where viewers are likely to stop watching. You could see a timeline of trouble spots, the share of your video that falls inside them, and a quality score. You could also see how your video compares with similar ones.
Then you tweak the weak parts, upload a new version, and check again. The filing also describes using the same predictions to decide where ads should go in a video.
… inputting the set of features for the first version of the first video into a trained watch time loss model trained to output watch time loss regions specifying time windows of an input video during which a likelihood of a viewer stopping playback exceeds a threshold likelihood; …
Translation: An AI model analyzes the video to find exact moments where viewers are likely to stop watching.
How the model finds where viewers walk away
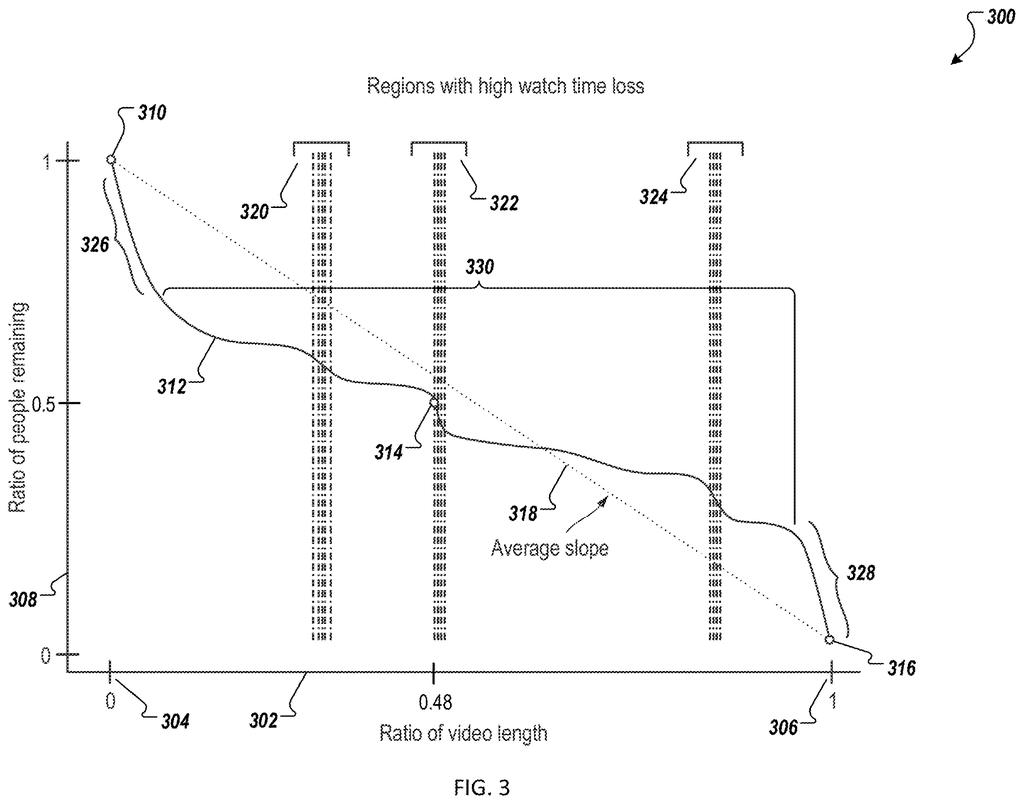
The system starts by learning from videos that already have plenty of viewers. For each one, it builds a watch time loss curve: a line showing what share of viewers are still watching at each moment. It then marks every stretch where that line drops faster than its overall average slope. Those stretches become the labels the model learns from. The very first and very last drops are thrown out, because nearly every video loses viewers at the start and the end.
Next, each video is described in numbers by a feature extractor (software that boils a video down to what it shows and sounds like). The features include:
- Raw appearance data from image-understanding models
- Visual features such as color and which objects appear
- Audio features describing the kinds of sounds
- Labels for what is happening in a frame (the filing's example is "biking" and "athlete")
The model is a bidirectional recurrent neural network, an AI that reads a sequence step by step while looking both backward and forward in time. In the filing's example, it examines 15 seconds before and after each second (31 steps in all) and outputs a score from 0 to 1 for how likely that moment sits inside a loss region.
The claims cover the loop around it. A creator uploads a first version and gets the predictions back. They then upload a revised version with fewer or shorter loss regions, and the platform streams that one.
A watch time loss region defines a time window of a video during which a likelihood of a user stopping playback of the video is more than a threshold likelihood.
Translation: These target areas are specific time spans where people frequently abandon the video.
What this means for creators and the ads around them
If you make videos, the useful part is timing. Without a prediction, you only learn where people left after they have already left. A forecast on upload day, with a timeline of trouble spots, the percentage of your runtime at risk and a comparison against similar videos, gives you a chance to fix things first. It also works for brand-new videos that have no viewer history yet.
Advertisers and the platform get something out of it too. The filing describes placing ads before predicted drop-off points, and sending ad files early or only on demand, which saves bandwidth. The claims tie the revised video to less streaming of content nobody watches. It is a patent application, so none of this means a tool exists today.
Google's 55th filing in the Enterprise AI patents we've tracked since May adds to a run that includes one grading video quality and one rewriting chip instructions.
If you upload videos, this could save you the slow, painful part of learning what bores people. You would see likely drop-off moments before publishing, edit them, and check again. That loop is easy to picture using, and it prevents the familiar sting of finding out weeks later.
If you only watch videos, the effect is harder to spot. The filing says ads can be placed before the moments viewers tend to leave, so the same prediction that helps creators could also pull ads earlier in what you watch. You would notice that in your viewing, even if you never see the tool.
The prediction comes from pictures and sound, so it can say where people tend to leave but not why. A creator still has to decide what to cut. As a feedback tool for creators, it is a sensible idea with a clear use.
Get our take in your Top Stories
Liked this breakdown? Add Patentlyze as a preferred source on Google, and our plain-English take shows up more often in your Top Stories the next time Google patent news breaks.
There are more where this came from
We read every patent application Big Tech publishes and send you the ones worth knowing. Plain English, free, every week.
The drawings
7 drawing sheets from US 2026/0352897 A1 · click any drawing to enlarge


Want this weekly breakdown for a company we don't cover? Patentlyze Pro →
Be the first to weigh in