
Google Patents an AI System That Flags Unusual Spikes in Data Streams
Every minute, countless dashboards silently accumulate data, and spotting the one number that shouldn't be there is harder than it sounds. Google has filed a patent for a system that trains a chain of AI models to define what 'normal' looks like, then flags anything that falls outside it automatically.
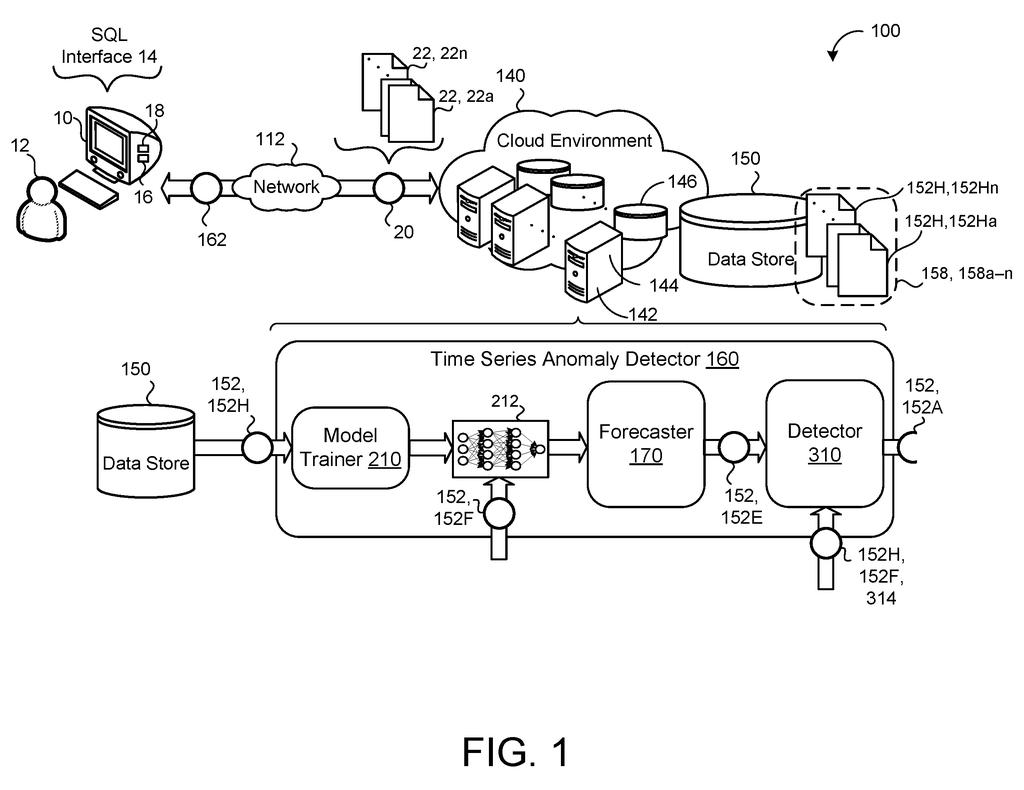
What Google's anomaly-detection system actually does
A server logs ten thousand requests per minute, day after day. Then one Tuesday it logs two million. Something is very wrong, but who's watching?
That's the problem Google's patent is designed to solve. The system takes a historical stream of data points (website traffic, sensor readings, sales figures) and trains a set of AI models on it. Those models learn what a 'normal' value should look like at any given moment. You tell the system how sensitive you want it to be by specifying a probability threshold, and it draws upper and lower boundaries around the expected value. Any real data point that lands outside those boundaries gets flagged as an anomaly and reported back to you.
The key design choice is splitting the modeling work across a chain of smaller, specialized models, one for each pattern it needs to track (long-term trends, daily cycles, short-term noise). That's meant to make the whole thing easier to scale as data volumes grow.
… determining, using the trained models, an expected data value for the respective time series data value and determining a difference between the expected data value and the respective time series data value.
Translation: The AI calculates what a normal data point should look like and measures how far the actual data deviates from it.
How the chain of models sets its normal-range boundaries
The system begins when a user (or an automated query) submits a time series anomaly detection request that includes a target anomaly probability. That probability is the user's way of saying how strict the system should be: a low probability means only extreme outliers get flagged; a higher probability casts a wider net.
The core machinery is a chain of two or more models, each trained on the same set of historical data values but responsible for a separate component of the signal. Think of it like breaking a stock-price chart into its long-run trend, its weekly seasonality, and its day-to-day random wobble, then handing each piece to a specialist. Together they produce a single expected value for every data point.
From that expected value and the user-specified probability, the system calculates an interval size, then sets an upper bound and a lower bound around the prediction. The math here is essentially a confidence interval: a range within which a normal reading should fall.
- If the real data point sits inside the bounds, it passes as normal.
- If it falls above the upper bound or below the lower bound, the system flags it as anomalous and reports it.
The chain structure is described as improving scalability, meaning the approach is intended to handle larger and more complex data streams without forcing a single monolithic model to learn everything at once.
What this means for cloud monitoring and data teams
For engineering and data teams, automated anomaly detection is table stakes for running any service at scale. Catching a server misbehaving, a payment processor spiking, or a sensor drifting off-range quickly can be the difference between a minor incident and a major outage. The appeal of a system like this is that you don't have to hand-craft rules for every possible failure mode; the models learn the baseline from history.
Google has been filing around AI-driven monitoring since at least 2024, which fits with the company's push to make its cloud infrastructure tools more autonomous. For you as an end user, the practical benefit would be fewer late-night alerts caused by someone manually missing a chart anomaly, and more consistent detection that doesn't depend on whoever set the threshold last year.
Google's 41st filing in the AI training and infrastructure work we've tracked since May builds on earlier applications on routing tasks to specialist models and compressing model weights.
The chain-of-models architecture is the one interesting design decision here, and it carries a real cost: each specialized sub-model has to be trained, maintained, and kept in sync with the others. If the trend model and the seasonality model disagree about what 'normal' means, the combined expected value can drift, and you end up with either false alarms or missed catches. The benefit of separability is scalability; the cost is coordination overhead that the patent does not fully address.
The user-specified anomaly probability is a sensible interface choice, but it also shifts real responsibility onto the person configuring the system. Set it too tight and you drown in noise. Set it too loose and the system misses the events it was built to catch. That's not a flaw specific to this patent, but it means the system's usefulness depends heavily on how well-calibrated the operator is, not just how good the models are.
Overall, this reads as competent engineering applied to a well-understood problem. Anomaly detection on time series data has been a research topic for decades, and the modular chain approach is a reasonable incremental improvement, not a departure from existing practice.
There are more where this came from
We read every patent application Big Tech publishes and send you the ones worth knowing. Plain English, free, every week.
The drawings
5 drawing sheets from US 2026/0278075 A1 · click any drawing to enlarge


Want this weekly breakdown for a company we don't cover? Patentlyze Pro →
Be the first to weigh in