
Microsoft Patents a Chart Tool That Builds Its Own Sliders When You Ask
Fixing a chart usually means digging through menus. This Microsoft patent application lets you just ask for the fix, and an AI builds a slider or drop-down for you to fine-tune it.
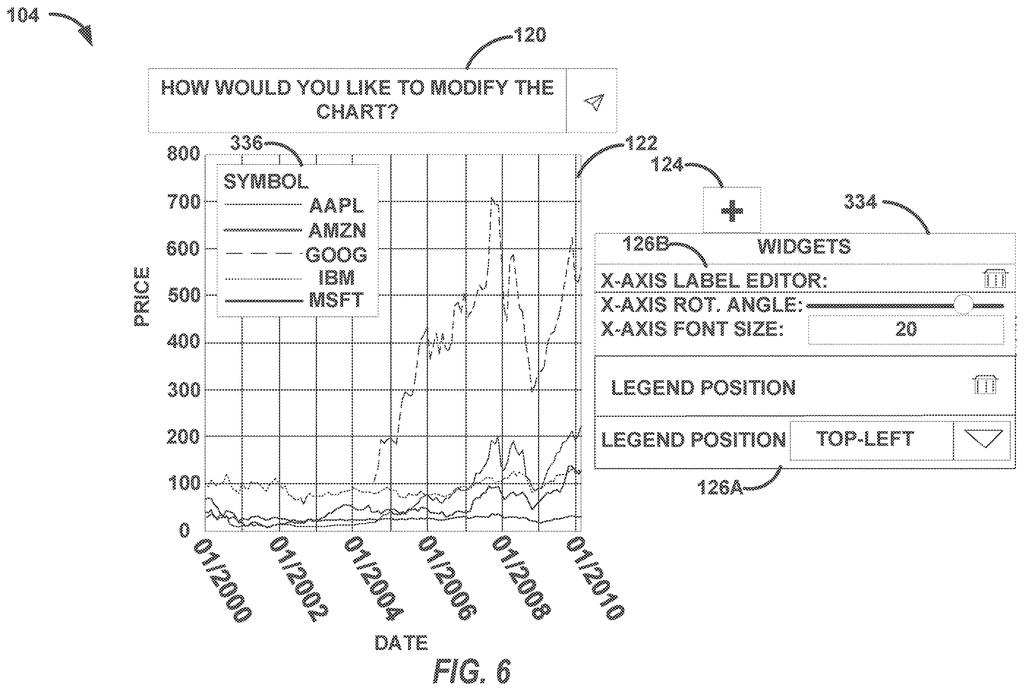
What Microsoft's on-demand chart sliders do
Today, changing something small on a chart, like tilting the labels along the bottom so they stop overlapping, can mean right-clicking the axis, opening a properties panel and digging through sub-menus until you find the right option. Microsoft's filing describes a different route: you type what you want in plain English, and the software builds a control for it on the spot.
Say you type "rotate the labels 45 degrees." The chart updates right away, and a small slider or drop-down appears beside it so you can nudge the angle yourself and watch the result. Ask for "a color picker for each stock," and you get one tailored to your data. The controls stay on screen, so you can come back and adjust later without typing again.
The goal is to combine the ease of asking an AI with the hands-on feel of dragging a slider.
… dynamically synthesizing a widget operable to alter the representation of the data on the chart based on user interaction with the widget, the widget including a visualization specification and a callback function …
Translation: The system automatically builds a custom control panel and the code needed to make it change the chart.
How the AI fills in a slider's code templates
The system has three working parts: a chart engine that draws and edits the chart, a widget engine that creates the controls, and a large language model (LLM, the same kind of AI behind chatbots) that writes the code for them. When you make a request, the widget engine sends the LLM a prompt containing two blank code templates and a description of the current chart.
- Visualization specification: a template for how the control looks, such as a slider or a drop-down menu.
- Callback function: a template for the code that runs when you touch the control and translates your input into a change to the chart.
The LLM fills in the blanks. Because the templates are strict, the output is more predictable. The prompt can also include a short data summary instead of the full dataset (models can only read so much at once), plus a few worked examples.
Before the control appears, the software checks the code by parsing it into an abstract syntax tree (a structured outline of the code that a program can inspect and fix). It repairs duplicate IDs against earlier controls, wrong function names and bad parameters. The chart is stored as a declarative specification (a plain list of settings), so each control changes only its own piece. When several controls filter data, their changes run in order, and each one gets an on/off switch.
A request can be received by the UI. The request can be provided by the user. The request can indicate an alteration to a representation of the data on the chart. A widget can be dynamically synthesized based on the request.
Translation: When a user asks to change how data looks, the software instantly creates a matching interactive tool.
Why chart edits could stop needing menu hunts
If you have ever made a chart in a spreadsheet or report, you know the two bad options: dig through menus for the right setting, or type request after request to an AI and wait for each reply. This filing aims for a middle path. The AI is called once to build the control, and every adjustment after that is instant and happens on your screen.
The company's own test with 24 people points the same way: 23 preferred it to a typing-only version, and they typed about 2.7 commands per task instead of 8.4. The filing also admits a catch. A screen that keeps adding controls can get overwhelming in long sessions, and some testers asked for ways to group them. This is a patent application describing a tool, not an announced product.
Microsoft's 597th filing in our Microsoft coverage since May adds to a run that includes an AI art placement tool and an AI game recap tool.
The problem here is small each time and large in total. Many people who have made a chart have lost ten minutes finding the setting that stops labels from overlapping. Multiply that across every spreadsheet and slide deck and it adds up to a lot of wasted time.
The fix fits the size of the problem. The AI is asked once to make a control, and after that your mouse does the work. That skips the slowest part of chatbot editing, which is waiting for a reply after every tweak.
The filing's study is small (24 people) and was run by the inventors, so treat the praise with care. Still, the downside the filing admits, a screen that keeps changing, is the right worry to have, and a tidy way to group controls would decide whether this feels helpful or cluttered.
Get our take in your Top Stories
Liked this breakdown? Add Patentlyze as a preferred source on Google, and our plain-English take shows up more often in your Top Stories the next time Microsoft patent news breaks.
There are more where this came from
We read every patent application Big Tech publishes and send you the ones worth knowing. Plain English, free, every week.
The drawings
15 drawing sheets from US 2026/0350867 A1 · click any drawing to enlarge


Show the other 7 sheets


Want this weekly breakdown for a company we don't cover? Patentlyze Pro →
Be the first to weigh in