
Adobe Patents an Interactive Chart That Tracks How Users Move Through Your Product
Adobe is patenting a way to visualize the paths real users take through a product or website, complete with live-updating charts that let analysts slice and filter the data without rebuilding everything from scratch.
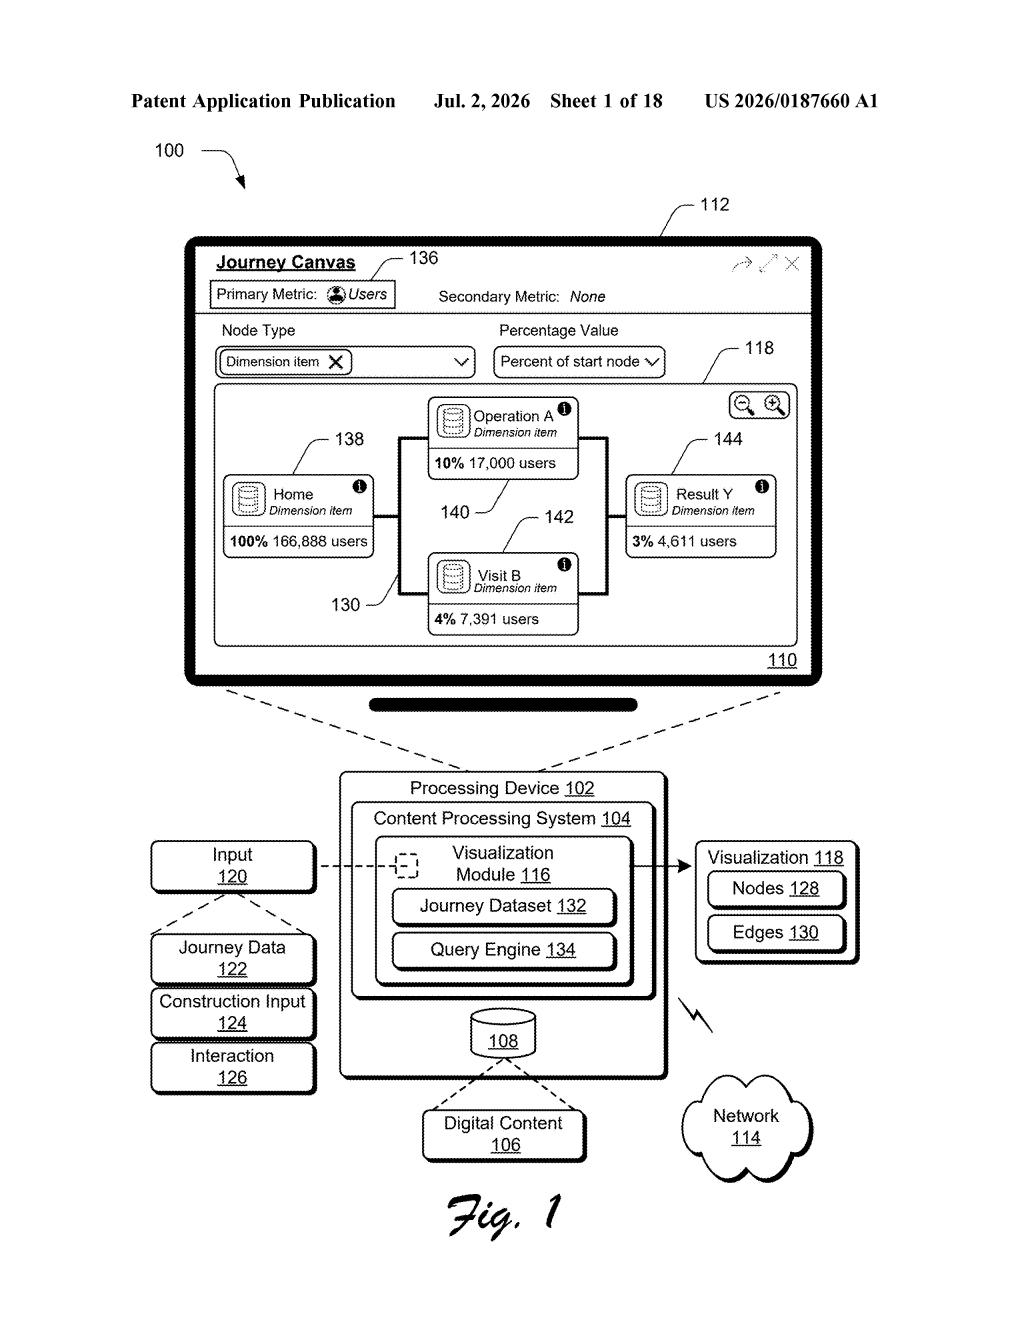
What Adobe's user journey visualization actually does
Imagine you run a mobile app and you want to know: of everyone who opens it, how many tap 'Sign Up,' and of those, how many actually finish registration? Today, answering that usually means pulling a report, waiting, then pulling another one if you want to break it down by, say, country or age group.
Adobe's patent describes a visual tool that maps those steps as a connected diagram, where each circle (node) is a stage in the user's journey and the lines between them show how many people moved from one step to the next. The key twist is that you can adjust filters live, and the whole diagram updates in real time, showing you new numbers without starting over.
This is the kind of tool that marketing and product teams would use to spot drop-off points and figure out which types of users get stuck where. It's a more interactive take on funnel analysis, a staple of analytics software.
How the nodes, edges, and metric transitions connect
The patent describes a method for building and displaying what it calls an interactive visualization of an aggregated user journey: essentially a flow diagram that represents, in aggregate, how a large group of users moves through a sequence of steps inside a product, website, or service.
The diagram is made up of:
- Nodes: circles or shapes that represent a specific stage or attribute in the journey (like 'opened app,' 'viewed product page,' or 'added to cart')
- Directed edges: arrows connecting those nodes that show the flow from one stage to the next
- Quantitative transitions: numerical indicators (counts, percentages, or other metrics) displayed along the edges to show how many users moved between two stages
The critical feature is the dimension adjustment. A dimension here is a categorical attribute, meaning a characteristic like device type, region, or membership tier. When an analyst changes or adds a dimension via the interface, the visualization updates in real time, re-filtering the underlying data and redrawing the numbers without requiring a full page reload or a new report run.
The processing system accepts what the patent calls a construction input to set up the initial diagram structure, then stays live and interactive as the user explores different cuts of the data.
What this means for Adobe's analytics ambitions
Analytics dashboards are common, but interactive, real-time funnel diagrams with live dimension filtering are harder to build and tend to sit inside expensive enterprise tools. Adobe already sells Adobe Analytics and is pushing its broader Adobe Experience Platform as a hub for customer data. A patented visualization engine like this could become a proprietary feature that differentiates Adobe's offering from rivals like Mixpanel, Amplitude, or Google Analytics.
For you as an end user, this kind of tool means your marketing or product team can answer follow-up questions on the fly during a meeting, rather than scheduling a separate report run. Whether Adobe ships this exactly as described or folds the ideas into an existing product remains to be seen, but it signals Adobe is investing in making analytics more interactive for non-technical business users.
This is a solid, practical patent in a space Adobe clearly wants to own. Interactive funnel visualization is not a new concept, but patenting a specific real-time dimension-adjustment method gives Adobe a legal foothold to protect whatever it builds on top of this. It's not flashy engineering, but it's the kind of infrastructure that matters when you're selling to enterprise marketing teams who live inside dashboards.
There are more where this came from
We read every patent application Big Tech publishes and send you the ones worth knowing. Plain English, free, every week.
Want this weekly breakdown for a company we don't cover? Patentlyze Pro →
Be the first to weigh in