
IBM Files Patent for Turning Code Into Clickable Flowcharts That Expose Bugs
IBM's patent application tries to open the black box of software testing by drawing a program as clickable flowcharts with live values laid on top.
What IBM's clickable bug-hunting flowcharts do
Every time a program crashes or spits out a wrong answer, a developer has to work out why. Often all a test report gives them is what went in and what came out, with the middle left as a black box.
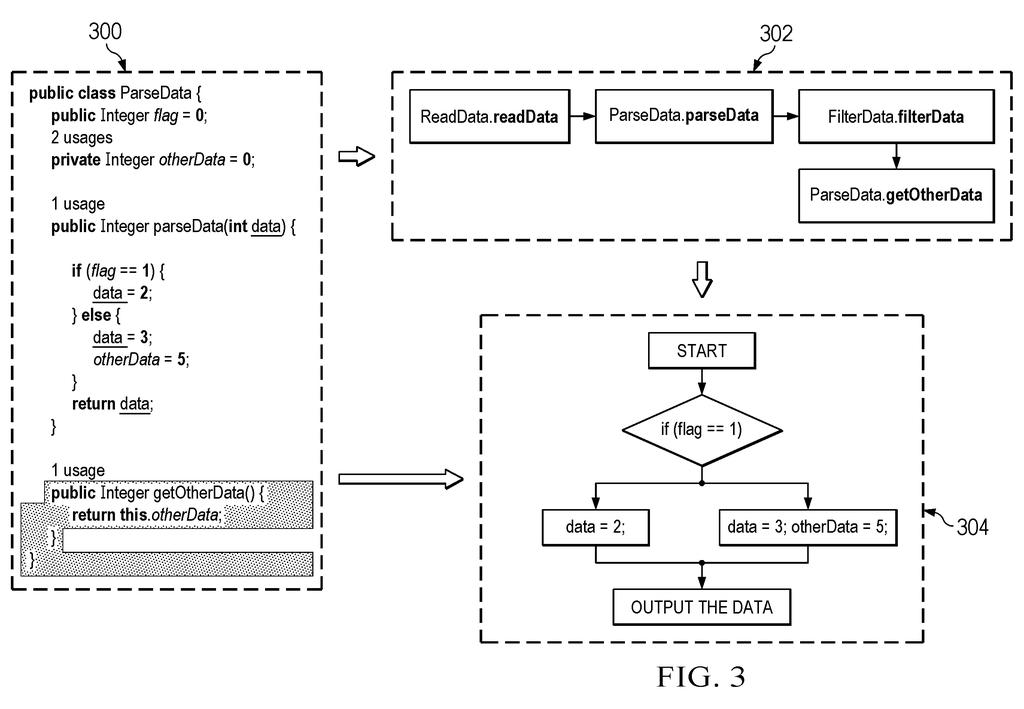
IBM's patent application describes a tool that reads a program's code and draws it as a clickable map. One chart shows which pieces of the program call which other pieces. Click any piece and you get a second chart showing the step-by-step logic inside it.
The tool can then run the code with different inputs and paste the resulting values right onto those charts. A person can scan them for something that looks off, or, according to the filing, a trained AI model can flag the bugs automatically.
receiving, by a processor set, a number of software artifacts for a program, wherein the number of software artifacts comprise at least one of source code or executable binaries for running the program; analyzing, by the processor set, the number of software artifacts for the program to identify code execution flows for the program; …
Translation: The system takes in program code or binaries and figures out how the program executes.
How IBM maps functions and tests their variables
The system starts with a program's software artifacts, meaning its source code (the instructions developers write) or its executable binaries (the compiled version a computer actually runs). It analyzes them to find the code execution flow, the order in which the program moves from one task to the next.
From that flow it builds two kinds of interactive chart, shown in a graphical interface:
- A function call flowchart, where each node (box) stands for a function, a reusable block of logic, and the lines show which functions call which.
- A function code execution flowchart for each node, laying out the step-by-step logic inside that one function.
The filing then describes generating test cases by feeding different values into those functions and recording what the variables hold afterward. That includes local variables, global variables, and environment variables (settings from the surrounding system). The recorded values are overlaid on the charts, so a developer sees them in place instead of flipping between views. In the filing's example, a function called ParseData.parseData is tested with different flag and data values.
Bugs can be found two ways. A developer reads the annotated charts, or machine learning models trained on source code, binaries, test data and previously found bugs flag problems automatically. Calls to third-party code, such as software kits, are treated as end points and are not analyzed further.
The number of visualizations are interactive visualizations displayed in a graphical user interface for a user. The processor set identifies a number of bugs associated with the number of software artifacts for the program based on the number of visualizations associated with the number of software artifacts.
Translation: It displays clickable diagrams that help the system find software bugs.
Why IBM wants developers to see inside the black box
If you have ever watched an app freeze and wondered how anyone finds the cause, this is aimed at that job. The filing says testing and development often happen in separate environments, which makes problems hard to reproduce, and that a typical test report shows only inputs and outputs. Putting the values on a visual map of the code gives developers a way to see where things went sideways.
For IBM, which sells software and developer tools to businesses, the pitch is catching bugs early, when fixes are cheaper than reworking code after release. The filing names no product, so for now it is simply a description of a debugging method.
IBM's 402nd filing in our IBM coverage since May continues a push into plain-language AI tools, joining work on vague time references and security queries in plain English.
Claim 1 is short and wide. It covers taking a program's source code or compiled files, working out how execution moves through the program, drawing interactive visuals of that flow, and finding bugs using those visuals. Flowcharts, test runs and AI models only show up in later claims that build on it.
The breadth is the interesting part. As written, claim 1 does not say whether a person or a machine spots the bug, so a wide range of visual debugging tools could fall inside its wording. Plenty of existing debuggers already trace how code runs, so the sharper ideas probably sit in the narrower claims, where test values are laid directly on top of the flowcharts.
For a working developer, the useful idea is simple: stop treating a test as a black box and show what happened inside it.
Get our take in your Top Stories
Liked this breakdown? Add Patentlyze as a preferred source on Google, and our plain-English take shows up more often in your Top Stories the next time IBM patent news breaks.
There are more where this came from
We read every patent application Big Tech publishes and send you the ones worth knowing. Plain English, free, every week.
The drawings
9 drawing sheets from US 2026/0319939 A1 · click any drawing to enlarge


Show the other 1 sheets

Want this weekly breakdown for a company we don't cover? Patentlyze Pro →
Be the first to weigh in