
Microsoft Patents a Way to Automatically Find Hidden Connections Between Spreadsheet Columns
Most spreadsheets hide relationships between their columns that even the people who built them don't fully see. Microsoft has patented a system that finds those hidden connections automatically, without anyone needing to look.
What Microsoft's column-relationship detector actually does
A data analyst stares at a spreadsheet with dozens of columns, trying to figure out which ones actually influence each other. That kind of detective work normally takes hours, and even then, you can miss things.
Microsoft's new patent describes a system that does this automatically. It looks at your table, generates a list of possible connections between columns, then runs a kind of statistical experiment: it nudges the data slightly and checks whether a suspected relationship still holds. If it does, the relationship is probably real. If it falls apart when the data shifts a little, it gets thrown out.
The result is a visual display showing you only the connections that passed the test. Instead of guessing which columns are linked, you get a map of the ones that almost certainly are.
… determining probability scores for the plurality of functional relationship candidates by perturbing the input table and ascertaining whether one or more of the plurality of functional relationship candidates holds …
Translation: It tests potential column links by slightly scrambling the table data to see which connections survive.
How the system tests and scores column relationships
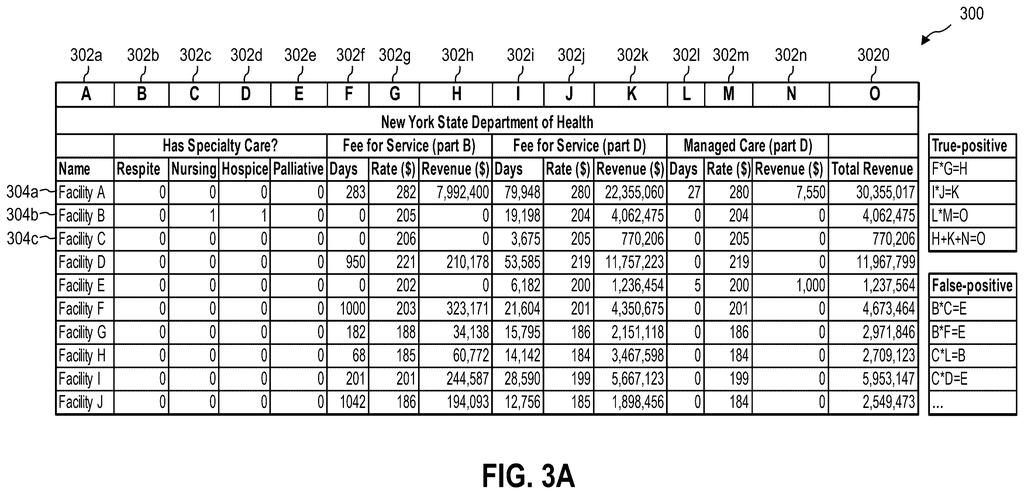
The system takes any input table and first generates a set of functional relationship candidates, essentially, guesses that one column might determine or predict the value of another. Think of it like asking: if you know the ZIP code, does that tell you the city?
To test each candidate, the system uses a technique called perturbation analysis (deliberately making small, controlled changes to the data). It tweaks values in the table and then checks whether the suspected relationship still holds. If the relationship survives repeated nudges, the system assigns it a high probability score. If it breaks down, the score stays low.
Candidates that score above a set threshold are kept; the rest are discarded as likely false positives (connections that looked real but weren't). The patent also describes speed-up options to make this process practical on large tables, where brute-force checking every possible column pair would be too slow.
Finally, the system generates a visual display attached to the original table that shows only the verified relationships, giving analysts an immediate, structured view of how their data is organized.
… leverage principled statistical tests based on hypothetical analysis that slightly “perturbs” values in an input table to determine the strength of a potential functional relationship …
Translation: The system checks how solid a data connection is by running what-if tests with minor changes to the numbers.
What this means for data analysts and Excel users
Data work is full of hidden assumptions baked into spreadsheets and databases. Someone built the table months ago, the documentation is gone, and now you have to figure out what everything means before you can trust any analysis you run on it. That problem is extremely common in large organizations, and the cost in analyst time is real.
A tool that maps column relationships automatically could speed up data cleaning, catch errors in database design, and make it easier to hand off datasets between teams. Microsoft's bet on AI-assisted data tooling suggests this is aimed at products like Excel and Power BI, where reducing manual data prep is a consistent priority.
Microsoft's 478th filing in our Microsoft coverage since May adds to a run that includes building agents from plain English and spotting gaps in documents.
The problem this patent addresses is not exotic. Figuring out how columns in a dataset relate to each other is a basic, tedious, and error-prone step that data workers deal with every day. The cost is low-visibility but high-frequency, exactly the kind of thing that chews through hours without ever feeling urgent enough to fix.
The perturbation approach is a reasonable way to filter out false positives. Checking whether a relationship survives small data changes is a principled test, not just a pattern-match, which matters if you want the output to be trustworthy rather than just plentiful.
Whether this ends up as a visible feature in Excel or stays under the hood in some data-cataloging tool is the open question. The patent itself describes a display layer, which suggests it's intended to surface to users, not just run silently. That is where the real value would land.
There are more where this came from
We read every patent application Big Tech publishes and send you the ones worth knowing. Plain English, free, every week.
The drawings
10 drawing sheets from US 2026/0300608 A1 · click any drawing to enlarge


Want this weekly breakdown for a company we don't cover? Patentlyze Pro →
Be the first to weigh in