Microsoft Patents a CPU Performance Sampler That Avoids Polluting Its Own Cache
Profiling a CPU is a bit like measuring your car's speed by adding a second engine to power the speedometer — the act of measuring changes what you're measuring. Microsoft's new patent tackles exactly that problem.
How Microsoft watches CPUs without slowing them down
Imagine trying to figure out why your computer is running slowly, but the very tool you use to diagnose the problem makes it run even slower. That's the awkward reality of CPU performance monitoring today: standard profiling tools can interfere with the processor's memory cache — the fast scratchpad chips use to avoid going to slower RAM — and end up distorting the data they're trying to collect.
Microsoft's patent describes a dedicated hardware controller that sits alongside the processor and handles all the sampling work on its own terms. You can program it to watch for specific events (a particular kind of processor instruction, for example), set how often it should take a snapshot, and define when it should start and stop — all through a set of dedicated control registers.
The clever part is where the collected data goes. Instead of flowing through the processor's normal cache — which would risk corrupting the very performance picture you're trying to capture — the data travels along a separate, uncacheable memory path directly to main memory. The processor barely notices it's being watched.
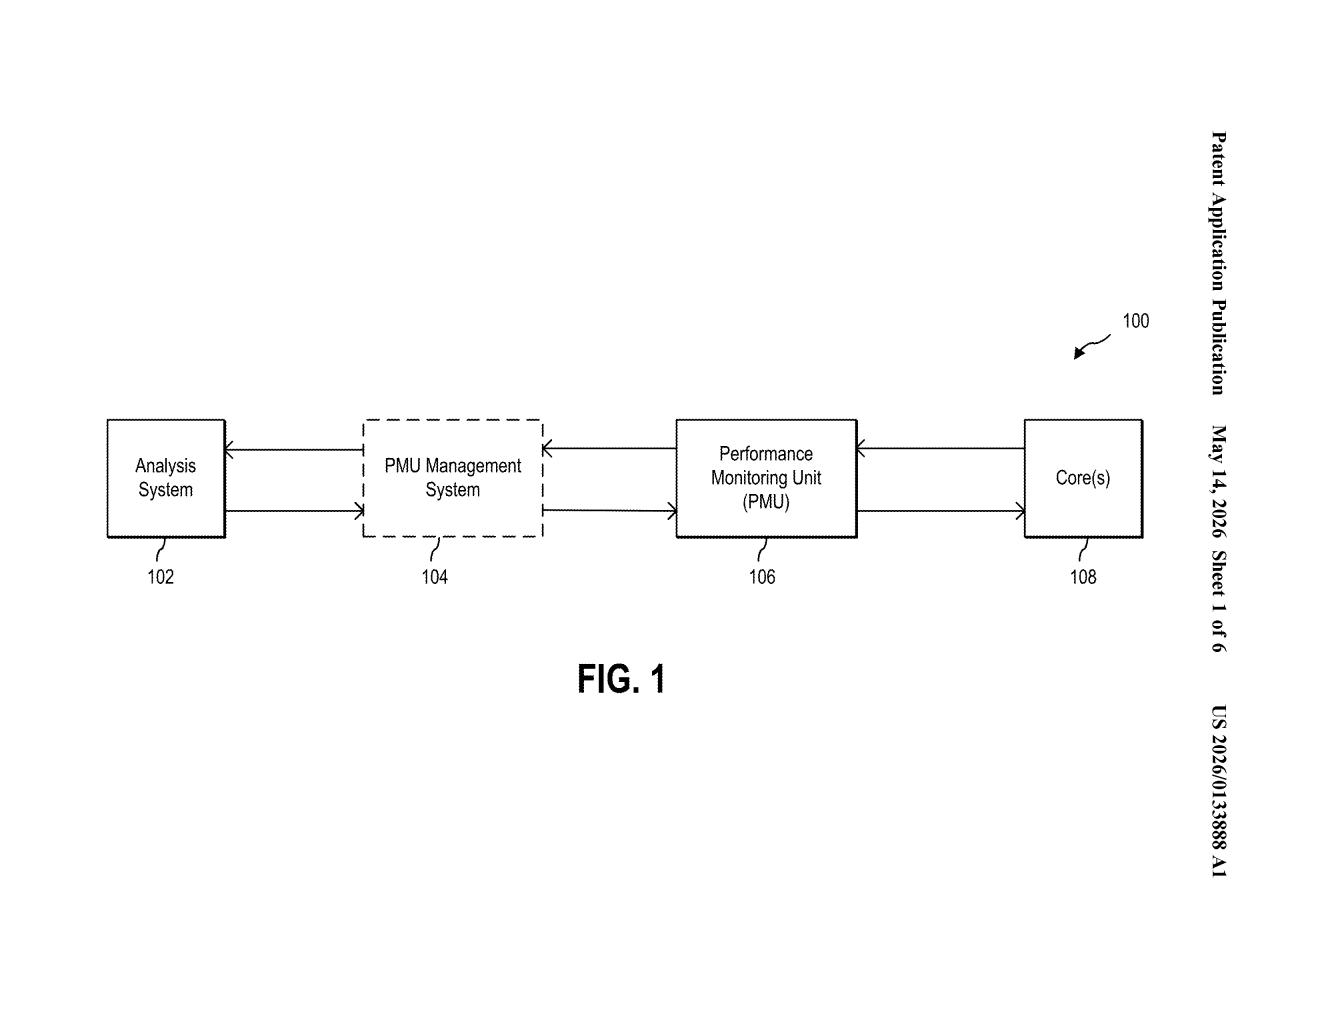
How the sampling controller routes data around the cache
The system centers on a sampling controller — a dedicated piece of hardware with its own set of control registers (small, fast storage slots that hold configuration values). Each register has a specific job:
- First register: defines the start and stop events that bracket a sampling window, plus how frequently samples should be taken
- Second register: specifies which CPU events to monitor (cache misses, branch mispredictions, instruction throughput, etc.)
- Third register: sets a control filtering exception level — basically a privilege filter that limits whether the PMU captures user-space activity, kernel activity, or both
- Fourth register: points to a buffer address in an uncacheable memory region where captured data lands
When the start event fires, the Performance Monitoring Unit (PMU) — the existing hardware block that counts processor events — begins generating a trace. Once the sampling frequency threshold is hit, the PMU flushes that trace to the uncacheable buffer. When the stop event fires, the sampling controller moves the full trace through an uncacheable memory path (a route that deliberately bypasses all CPU cache levels) to the main memory subsystem.
Bypassing the cache is the key architectural insight. Normal memory writes would evict live data from the cache, subtly degrading the workload being profiled. By routing PMU data around the cache entirely, the system collects a clean, uncontaminated performance picture.
What this means for cloud and developer performance tools
For cloud providers and hardware vendors, accurate CPU profiling is genuinely valuable — it's how you tune workloads, identify bottlenecks, and validate that a chip is behaving as expected under real-world conditions. If your profiling tool introduces noise, you're optimizing against a distorted baseline. Microsoft runs some of the world's largest data centers through Azure, and even small per-core inefficiencies multiply across millions of servers.
For developers using tools like perf, VTune, or Windows Performance Analyzer, this kind of hardware-level isolation could eventually surface as cleaner profiling data with less "observer effect." It also hints at Microsoft's ongoing investment in custom silicon — a sampling controller like this is exactly the kind of component you'd bake into a purpose-built datacenter chip.
This is unglamorous infrastructure work, but it's the kind of careful systems engineering that compounds over time in a large cloud environment. The uncacheable memory path is an elegant solution to a real observer-effect problem, and the configurable register model gives it genuine flexibility. Worth a quiet bookmark if you follow datacenter silicon or developer tooling.
Which company should we read for you?
We track 17 companies here. Pro is the same weekly breakdown for any company you choose, delivered privately. Type a name and we'll scope it and send you a quote.
Get one Big Tech patent every Sunday
Plain English, intelligent commentary, no hype. Free.
Editorial commentary on a publicly published patent application. Not legal advice.