
Google Files Patent for Forecasting Sales of Millions of Products at Once
Google describes a way to forecast demand for millions of products at once by chopping the job into tiny pieces and storing every result in one oddly shaped table.
What Google's forecasting patent actually does
You run an online store with a million products, and your boss wants to know how many of each you'll sell next month. Weather, holidays and promotions all nudge the numbers, and nobody has time to build a separate prediction tool for every item.
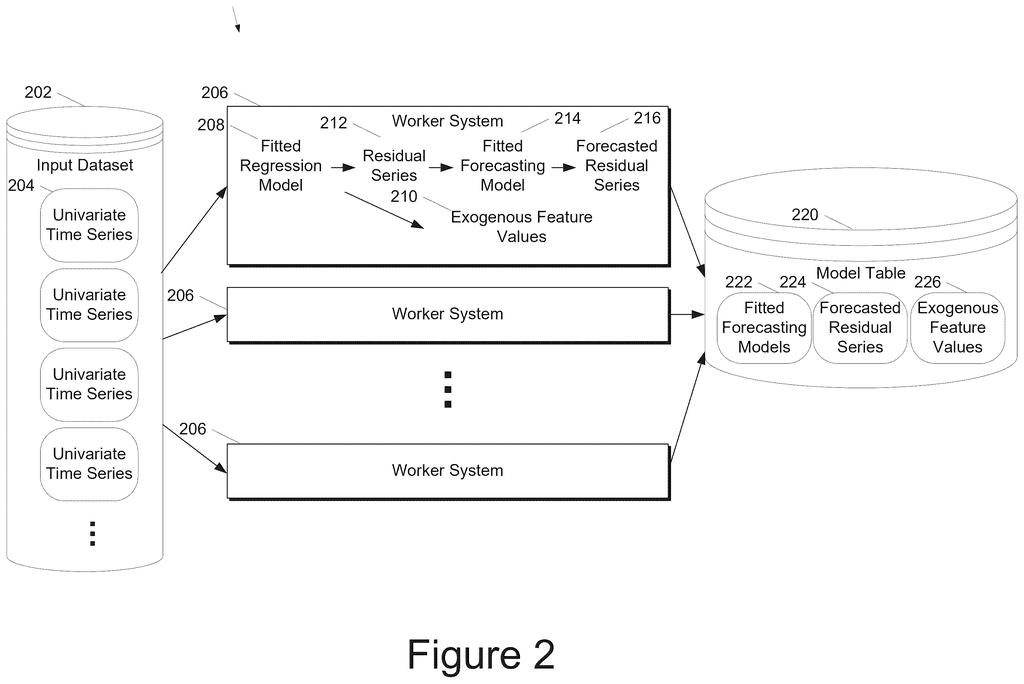
Google's patent application breaks that giant job into a million small ones. First, the system looks at each product's sales history on its own and strips out the push from outside factors, leaving a cleaner pattern. Then it predicts each cleaned-up pattern separately, with many computers working side by side.
The results all land in one big table instead of a million separate files. When fresh sales data arrives, the system looks up the saved predictions, adds the outside effects back in, and produces a forecast for every product at once.
obtaining an input dataset comprising a plurality of univariate time series respective to a plurality of endogenous variables; identifying a plurality of fitted regression models respective to the plurality of univariate time series by parallelized independent regression on each univariate time series of the plurality of univariate time series; …
Translation: The system takes in past data and analyzes each product or variable separately at the same time.
How Google splits one forecast into millions
The input is a big table of numbers over time, such as daily sales for every product. Each product has its own timeline (a univariate time series, meaning one measurement tracked over time) tagged with an ID. The system sorts rows by that ID into separate subtables and hands each one to its own worker computer.
From there, the claimed method runs in four steps:
- Regression (fitting a line that shows how outside factors push numbers up or down) runs on every timeline in parallel, possibly from a single database query. Linear regression is the example given.
- The residual (what is left after removing that outside influence) is the "pure" pattern. The outside effects are saved as a weight and an intercept, and they can stay unlabeled, such as "feature 1".
- Each residual gets its own forecasting model. ARIMA (a classic statistical method that picks up repeating cycles) is the example, and the system can try several candidates and keep the best scorer.
- Everything is stored in one model table.
The table uses a "diagonal" layout. Model settings, forecasts and outside-factor values each get their own columns, and unused cells hold empty (null) values so lookups can skip them. The filing admits this makes the table bigger.
To forecast, the system takes new data, pulls the saved residual forecasts and adds the outside effects back in.
Model parameters, forecasted residual series, and exogenous feature values may be stored in a multivariate model table for each endogenous variable. Forecasted time series data can then be generated using this table.
Translation: All the calculated predictions and underlying patterns are saved in a central table to generate the final sales forecasts.
What this means for stock forecasts at retail scale
The practical payoff is scale. The filing's own example is a retailer that must predict stock and delivery schedules for huge product catalogs, where building and tracking one forecasting model per item is too much work. If one request can produce every forecast, that job gets much more manageable for the people running it.
The filing describes the system as possibly offered as a web forecasting service, with a single database query kicking off the work. For you, the effect would be indirect: better-timed stock, fewer empty shelves, and more accurate delivery estimates. The filing also says the same approach could handle weather, production or logistics data, so retail is the example it leans on most rather than the only use.
Google's 23rd filing in the AI recommendation patents we've tracked since May adds to a run that includes one on keeping ad AI current and one on keeping advertiser data separate.
Shipping this would take little more than software. It needs no new hardware, only a group of ordinary computers and a database. The filing names familiar statistical tools, a straight-line fit and a classic cycle-spotting forecaster, so there is little new science to prove first.
The shortest route to a feature is a forecasting option inside a data service that already holds a company's sales history. A customer would ask for forecasts on all their products in one request, and the splitting would happen behind the scenes. What has to exist first is the large pool of worker computers and the data, which a big cloud company would likely already have.
The honest verdict: routine engineering, and useful. You would likely never see it directly; you would just find the item you wanted in stock. The open question is whether the bulky table layout really speeds things up, since the document offers no measured results.
Get our take in your Top Stories
Liked this breakdown? Add Patentlyze as a preferred source on Google, and our plain-English take shows up more often in your Top Stories the next time Google patent news breaks.
There are more where this came from
We read every patent application Big Tech publishes and send you the ones worth knowing. Plain English, free, every week.
The drawings
8 drawing sheets from US 2026/0320153 A1 · click any drawing to enlarge


Want this weekly breakdown for a company we don't cover? Patentlyze Pro →
Be the first to weigh in