
Waymo Patents a System That Grades Its Own Autonomous Driving Decisions
Waymo has filed a patent for a method that lets a self-driving car evaluate its own driving quality in real time by comparing two different views of the road ahead: one based on how traffic normally behaves, and one based on how traffic could behave at its worst.
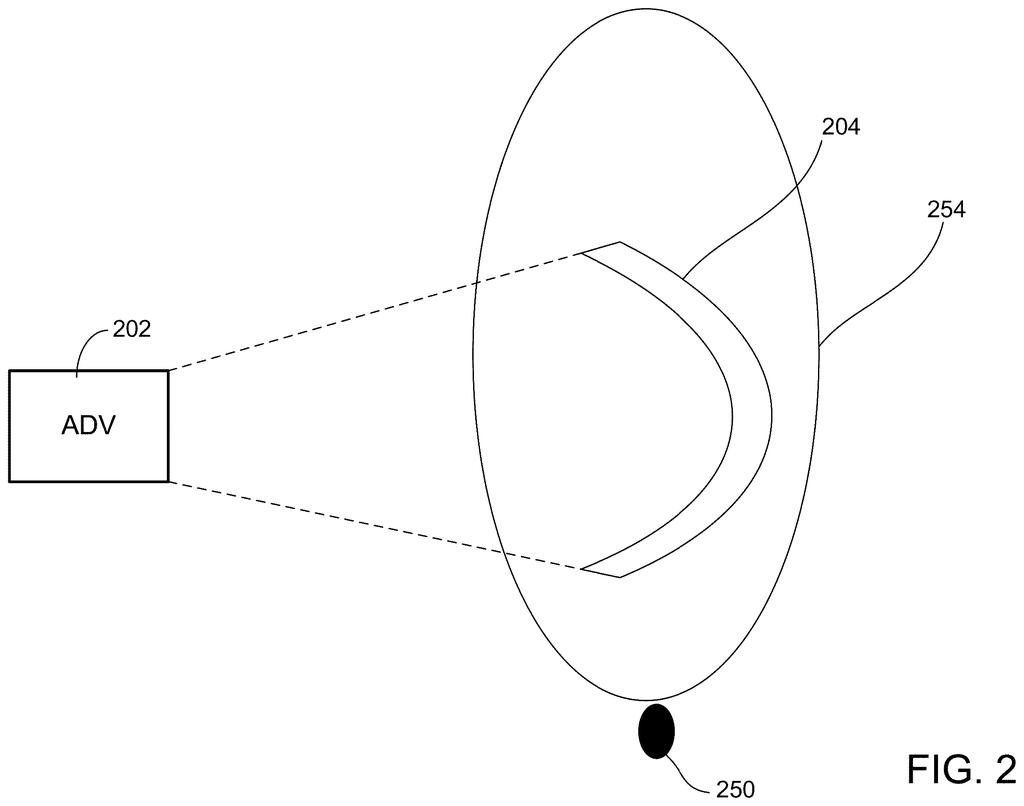
What Waymo's self-grading driving assessment actually does
Ever worried whether a self-driving car is actually driving well, or just getting lucky? That's the gap Waymo is trying to close with this patent.
The system works by drawing two versions of the space available to the car at any moment. The first picture assumes every other driver on the road will act normally. The second picture assumes they might do something surprising, like brake suddenly or swing wide into another lane. By comparing those two pictures, the car can score its own behavior: if it kept a comfortable amount of road available even in the worst-case picture, it was driving well. If the worst-case picture shows it had almost nowhere to go, that's a warning sign.
Think of it like a pilot checking both the normal flight path and the emergency escape route at the same time. The score that comes out of that comparison is a driving metric, a number that can flag cautious driving, reckless driving, or anything in between.
… computing a first plurality of reachable sets for one or more other road users in the driving environment using a normal set of movement parameters; computing a second plurality of reachable sets for the one or more other road users in the driving environment using an expanded set of movement parameters; …
Translation: The system maps out where other drivers might go using both normal and aggressive movement assumptions.
How the two-map comparison scores each driving move
The patent describes a computer method that runs alongside the car's normal driving software to assess driving quality. It takes in a snapshot of everything around the car: other vehicles, cyclists, pedestrians, their speeds and positions.
From that snapshot, it calculates two sets of reachable sets (the full range of positions every nearby road user could plausibly reach in the next few seconds). The first set uses normal movement parameters, meaning typical acceleration, braking, and steering ranges. The second set uses an expanded set of movement parameters, accounting for more extreme maneuvers that are legal but unusual.
Each set of reachable sets produces a corresponding drivable area for the self-driving car itself: the portion of the road it could safely occupy without conflicting with others. A large drivable area means the car has plenty of room. A shrinking one means it is being boxed in.
The final output is one or more driving metrics computed from the difference between those two drivable areas. A big gap between the normal-case area and the worst-case area could signal that the car is in a fragile position. A small gap means it is holding its ground even under pressure. Those metrics can be used to audit driving logs, tune the driving software, or flag trips that warrant a closer look.
… computing a first drivable area for the ego agent based on the first plurality of reachable sets; computing a second drivable area for the ego agent based on the second plurality of reachable sets; and computing one or more driving metrics based on the first drivable area and the second drivable area computed for the ego agent.
Translation: It then determines safe zones for its own vehicle and grades its performance by comparing those areas.
What better self-assessment means for Waymo riders
For anyone riding in or relying on a Waymo vehicle, this kind of self-assessment is the mechanism that catches problems before they become incidents. A car that only grades itself against ideal traffic conditions might look fine on paper while making choices that leave very little margin for error when another driver does something unexpected. This system tries to close that gap by baking the unexpected into every score.
From an operational standpoint, Waymo's interest in autonomous driving safety metrics points to a company that wants structured, repeatable evidence of safety rather than anecdotes. Logged driving metrics from real trips give engineers a tool to compare software versions and spot regressions without waiting for a real-world near-miss to surface the problem.
Google's 62nd filing we've tracked since May in the self-driving sensing race extends its perception work beyond predicting road user paths and all-weather sign reading.
The practical payoff here is that your ride gets evaluated against a harder standard than "nothing bad happened." A car that squeezed through a merge with no room to spare technically succeeded, but a metric that captures how little margin it had gives engineers a way to catch that pattern before it becomes a habit.
The two-map approach is genuinely clever because it separates two different questions: how did the car do assuming normal traffic, and how did it do assuming traffic could misbehave? Both answers matter, and tracking them separately lets a safety team pinpoint where the driving software is cutting it too close.
That said, this is an internal assessment tool, not something a rider would ever interact with directly. The benefit flows upstream: better metrics lead to better software updates, which eventually lead to a smoother, safer ride. The gap between filing a patent and a rider feeling the difference is wide, and that is worth keeping in mind.
There are more where this came from
We read every patent application Big Tech publishes and send you the ones worth knowing. Plain English, free, every week.
The drawings
7 drawing sheets from US 2026/0296502 A1 · click any drawing to enlarge


Want this weekly breakdown for a company we don't cover? Patentlyze Pro →
Be the first to weigh in